

Tail risk and the black swan
Success can cause fragility. Portfolios that appear diversified are often highly concentrated in the same underlying risks: equity beta, growth, liquidity, credit and duration. Preparation, not prediction, is the goal.
For professional clients and eligible counterparties only
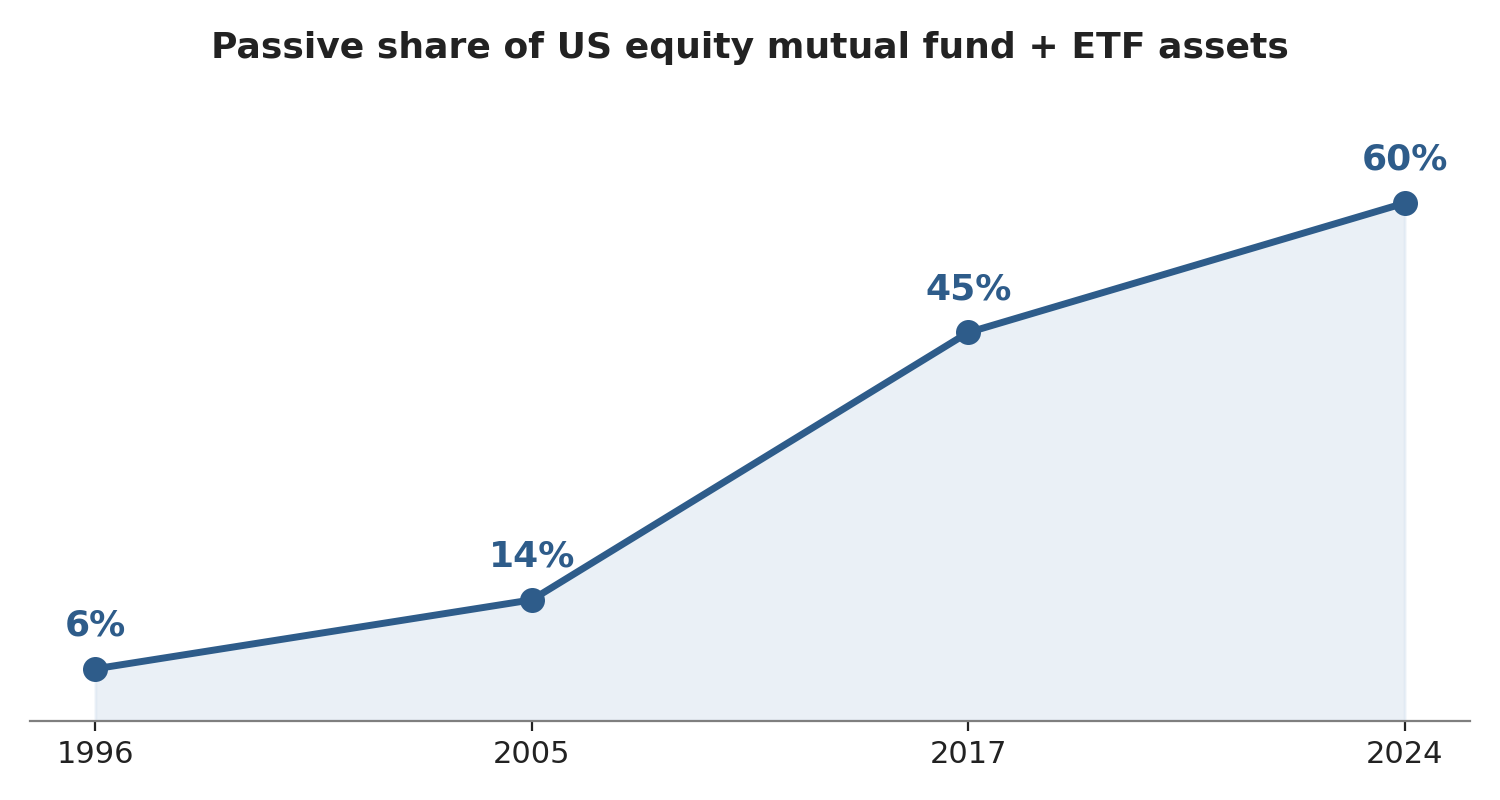
For two decades, passive investing and market-cap-weighted indices have delivered exceptional returns. Falling rates, abundant liquidity and strong equity markets reinforced the belief that broad market exposure and conventional diversification are enough to navigate future turbulence.
Capital has migrated into market-weighted indices. Portfolios that appear diversified are often highly concentrated in the same underlying risks: equity beta, growth, liquidity, credit and duration. Recency bias encourages investors to assume that what worked will continue to work.
Black swans and tail risk: related, but not the same
The terms are often used interchangeably, but they describe different things. A black swan, a concept popularised by Nassim Nicholas Taleb in 2007, describes an event with three defining characteristics:
- It is an outlier outside normal expectations.
- It has extreme impact.
- It is explainable only after the fact.
Before Europeans encountered Australia, they assumed all swans were white; a single sighting overturned centuries of assumed knowledge.
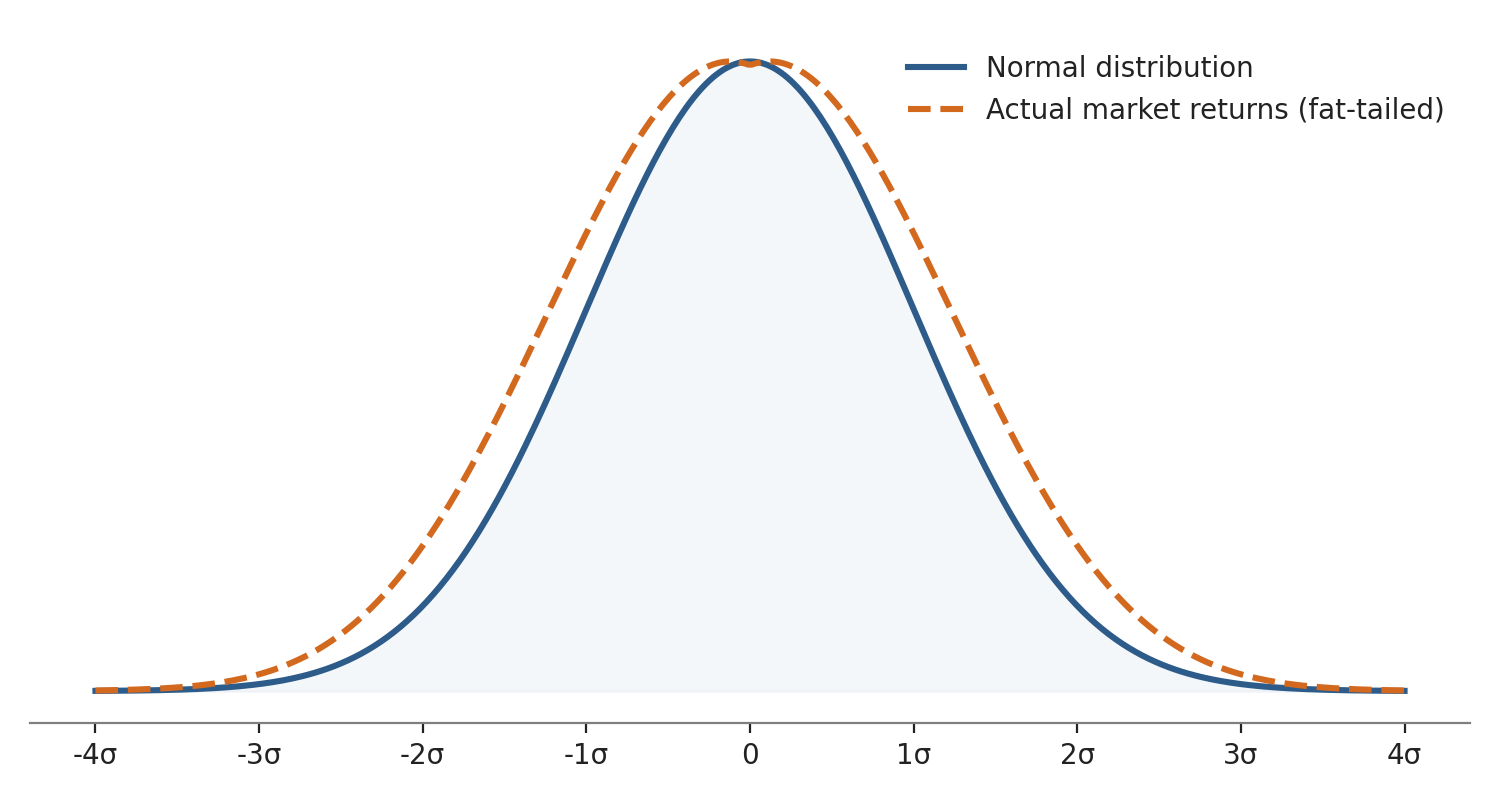
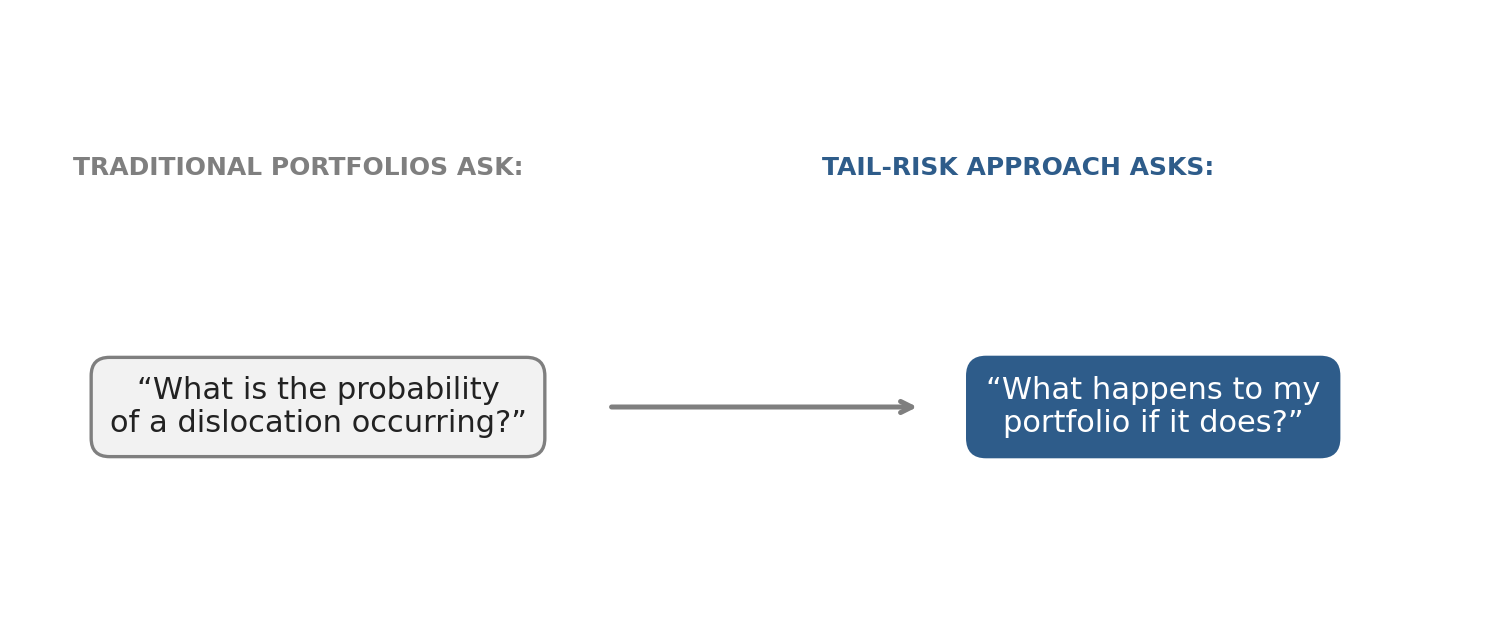
Tail risk is a related but narrower statistical concept: the possibility of an asset or portfolio moving more than three standard deviations from its expected value. In theory, tail risk is quantifiable, even if its occurrence is rare, whereas a genuine black swan sits outside the model altogether. Thinking in these terms helps investors consider not just how likely an extreme move is, but how much volatility a portfolio can realistically absorb if one occurs.
History offers no shortage of examples, and the numbers behind each are a useful reminder of just how large “extreme” can be:
- The 2000 to 2002 dot-com bust: the S&P 500 fell 49% and the Nasdaq fell 78% peak to trough; the S&P 500 did not reclaim its prior high until 2007, nearly seven years later.
- 9/11 (2001): US markets closed for four trading days, the longest closure since 1933; on reopening, the Dow fell 7.1% in a single session and 14% for the week, yet the S&P 500 was already trading above its pre-attack level by mid-December 2001.
- The 2008 financial crisis: the S&P 500 fell 56.8% over 517 days and did not recover to a new high until March 2013, more than four years after the trough.
- COVID-19 (February to March 2020): the S&P 500 fell 33.9% in just over a month, the fastest bear-market decline on record, before recovering to a new high in roughly five months, the fastest recovery of any major modern crash.
These events expose the limitations of our models. Financial models are built on historical distributions that treat extreme outcomes as vanishingly unlikely. In reality, markets exhibit fat tails: extreme moves happen more regularly than institutional models suggest.
Globalisation and long calm periods create a false sense of stability, increasing the potential for devastating surprises. We underestimate the probability of events outside our immediate experience and find it psychologically difficult to spend money today protecting against something that may never happen. Yet the cost of protection must be weighed against the potential cost of total ruin.
Especially amid heightened geopolitical tensions and increasing macroeconomic uncertainty, predicting the next black swan or timing markets around tail risk is extremely challenging. The aim is not prediction. It is preparation: building a portfolio robust enough that the next surprise, whenever and whatever it turns out to be, does not derail a long-term plan.
Turning defence into offence
Black swan investing is less about predicting the next crisis than about structuring a portfolio so that extreme events cannot cause ruin and may even create substantial upside.
Anti-fragility: systems that gain from disorder
Taleb’s proposed solution is antifragility: structuring portfolios not just to survive, but to benefit from disorder. An antifragile portfolio:
- Survives the initial shock (no ruin).
- Has liquid capacity when others are forced sellers.
- Benefits from repricing during uncertainty.
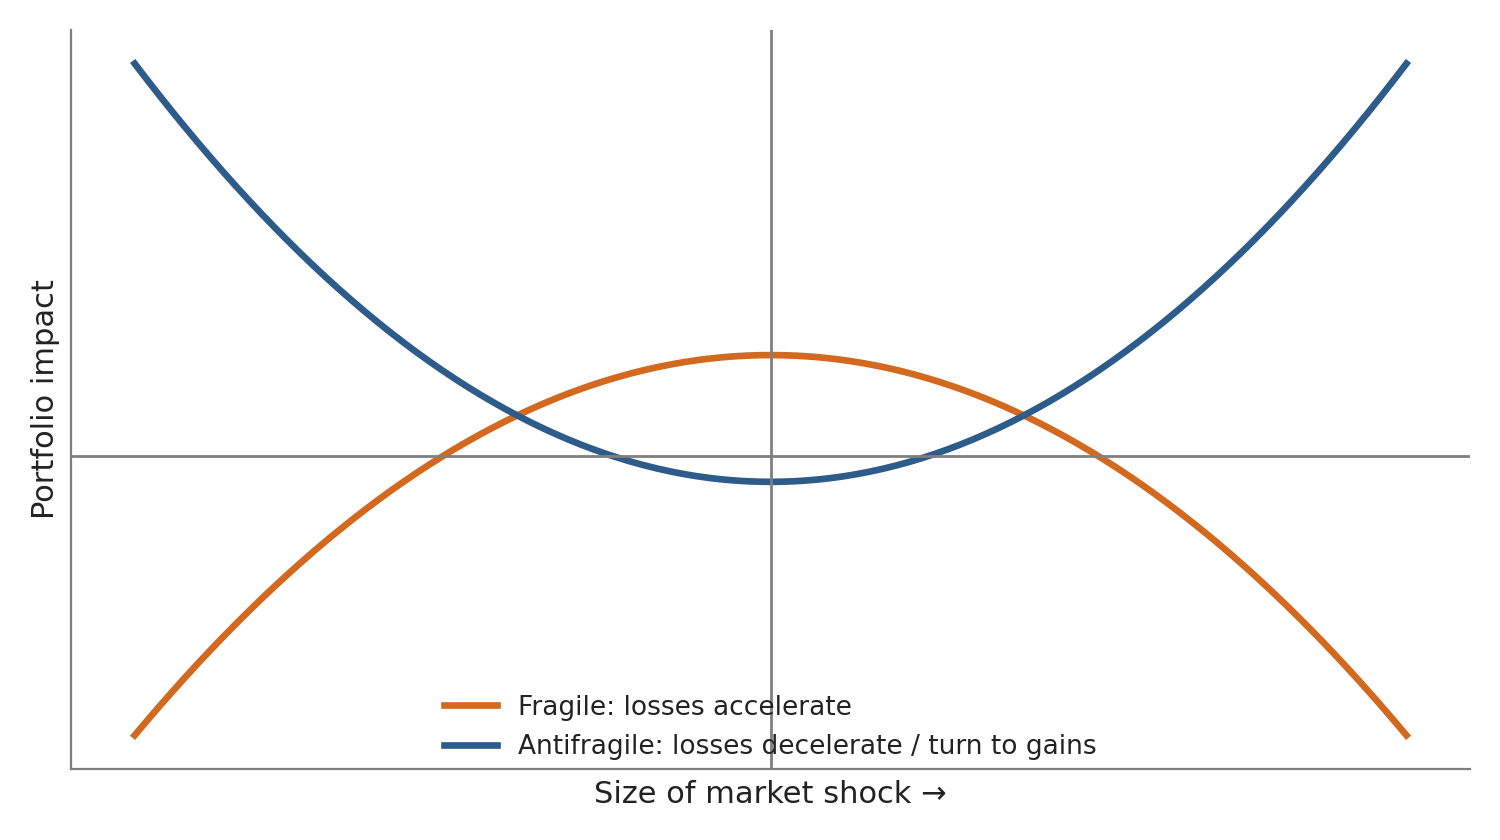
This requires positive convexity payoffs, meaning a payoff that gains disproportionately more as the size of the move gets larger. A long option, for example, loses its premium in normal markets but can explode in value during severe moves. The cost in calm periods is the price of antifragility.
The practical test is how does a portfolio behave under progressively larger shocks? If losses accelerate, it is fragile. If losses decelerate or turn into gains, it is antifragile.
This requires distinguishing between survival capital, which protects the balance sheet and provides liquidity, and opportunity capital, which exploits dislocations created by extreme events.
The barbell approach
The classic expression of antifragility is the barbell:
- 85 to 90% in ultra-safe, liquid assets (short-term government bonds, cash, T-bills).
- 10 to 15% in high-convexity, asymmetric bets (long-dated options, venture, distressed opportunities, volatile growth).
- Minimal exposure to the “middle” (moderate-risk assets that feel safe but carry hidden, correlated tail risk).
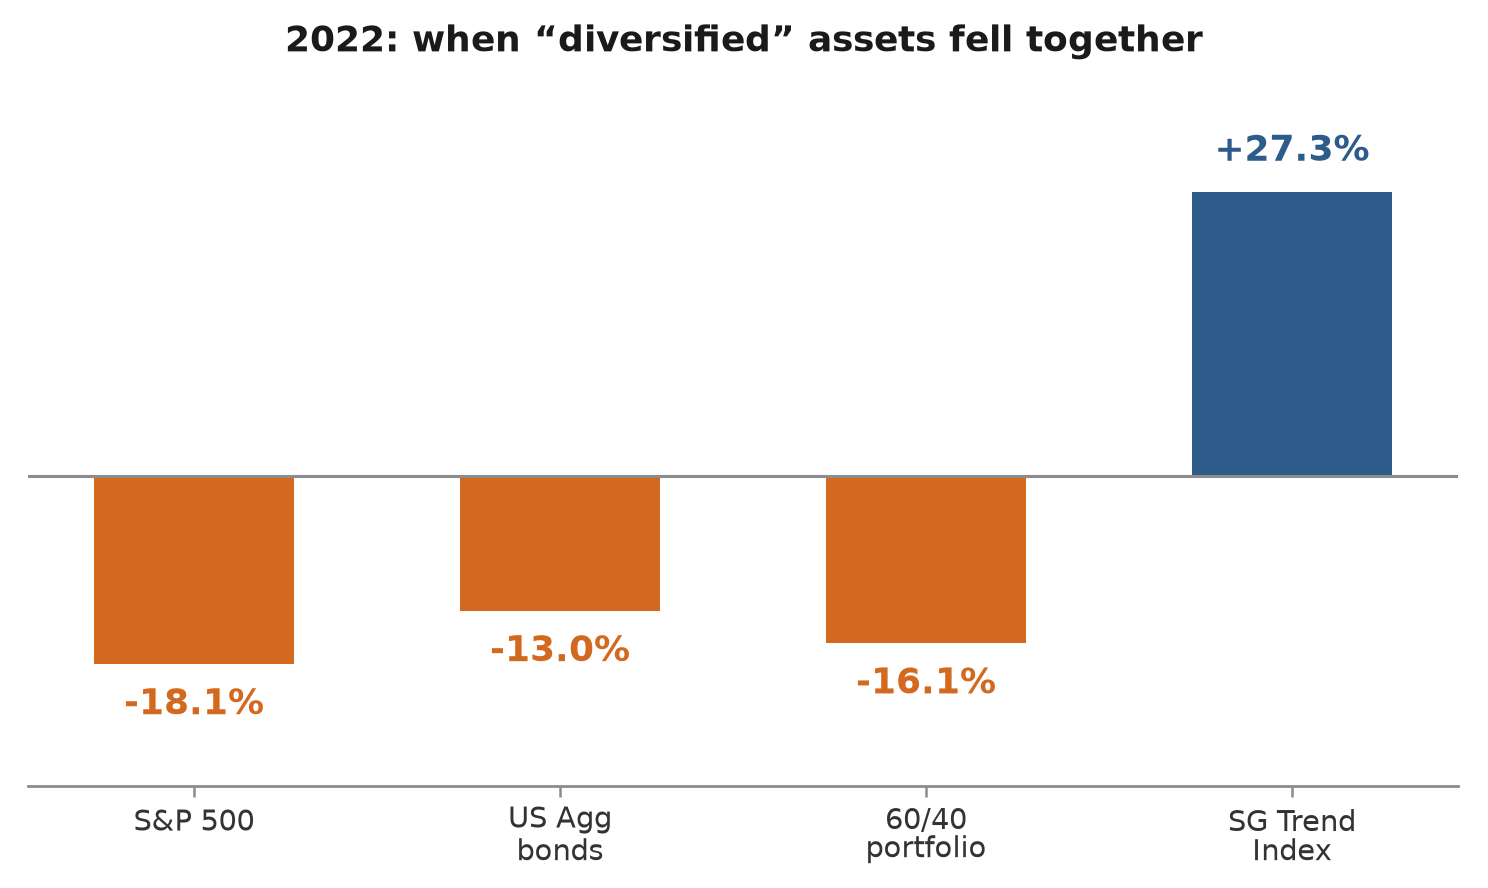
Why avoid the middle? Medium-risk assets, such as investment-grade corporates or balanced funds, often appear diversified but share the same equity, credit and volatility risk factors. In crises, they tend to fall together, undoing the illusion of diversification.
2022 was a live demonstration of exactly this risk. Equities, bonds and a standard 60/40 blend all fell together, while a genuinely convex, trend-following strategy (the SG Trend Index) gained 27.3%.
Barbell objectives
- Survival sleeve: preserves capital and provides liquidity to avoid forced selling.
- Opportunity sleeve: limited downside (can go to zero) but large upside if positive black swans occur.
Important caveats
A 90/10 barbell is not automatically antifragile. It depends on:
- Quality and liquidity of the safe assets.
- Absence of hidden correlations between the two sleeves.
- Financing, collateral and margin structures that don’t force liquidation in stress.
- Cost and maturity of hedges (cheap, long-dated convexity is ideal).
- The investor’s ability and mandate to rebalance after shocks.
How Tail Risk is Managed now - ‘Enhanced Tail Risk’
Four approaches now dominate, and the stronger programmes combine them. Our next blog post will go further into detail on these approaches.
Trend-following and managed futures. CTAs run trend strategies across dozens of liquid markets, short what is falling and long what is rising.
Active management of the option book. Where puts are used, they are no longer simply rolled on a schedule. Vineer Bhansali, who led tail hedging at PIMCO before founding LongTail Alpha, treats a convex book as something to trade: when a hedge appreciates in a selloff, part of the gain is crystallised and moved into risk assets while they are depressed. Run this way, the hedge becomes a source of capital at the point when capital is scarcest.
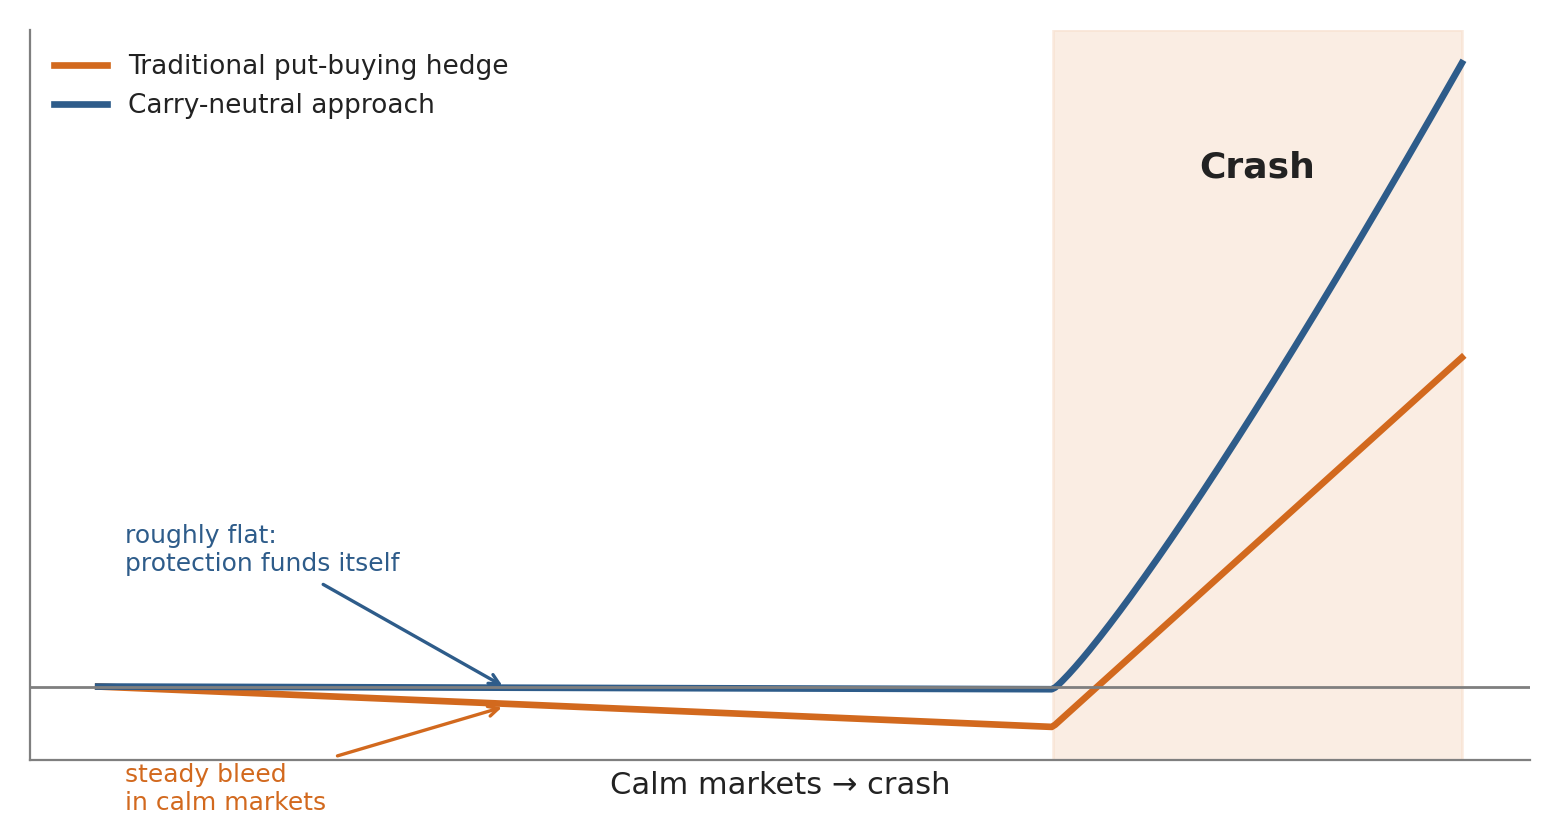
Long-volatility and relative-value structures. This is where the field has moved furthest, and it goes at the bleed directly. Rather than pay premium and wait, a long-volatility manager runs long and short option positions together and earns a separate, uncorrelated return from short-term dislocations in market flow. The goal is genuine carry-neutrality: protection that is funded rather than paid for and so costs little or nothing to hold through a normal year.
Dedicated convex tail funds. At the specialist end sit funds built to convert a small, steady cost into a very large payoff in a crash.
Conclusion
Black swan events are both a structural problem for conventional portfolios and a strategic opportunity for those who design for uncertainty. Historically, committing capital to tail-risk protection meant accepting lower returns in the many scenarios where no crisis arrives – the premium paid for insurance one hopes never to use.
But that trade-off is no longer a given. Carry-neutral approaches that pair convex tail exposure with an uncorrelated, return-generating engine are designed to offset the ongoing cost of protection – aiming for a structure that behaves like a hedge when markets break, yet does not steadily bleed while it waits.
It is no longer simply whether to accept the cost of protection, but whether protection needs to carry a meaningful cost at all. Seen through the full market cycle, tail-risk allocation is not an optional overlay for the cautious – it is a core discipline of capital preservation.
Preparation, not prediction, is the goal. No one can know what the next outlier will be or when it will arrive – only that one eventually will.
Thinking about where this sits in a portfolio?
Start the conversationThis article is for informational purposes only and does not constitute investment advice or a recommendation to buy or sell any financial instrument. Past performance is not a reliable indicator of future results. Tail-risk and options-based strategies involve leverage, derivatives and other risks and may not be suitable for all investors. Please consult a qualified financial adviser before making any investment decision.